Conceptual Map of the Adaptive Framework (Fig 1.1)
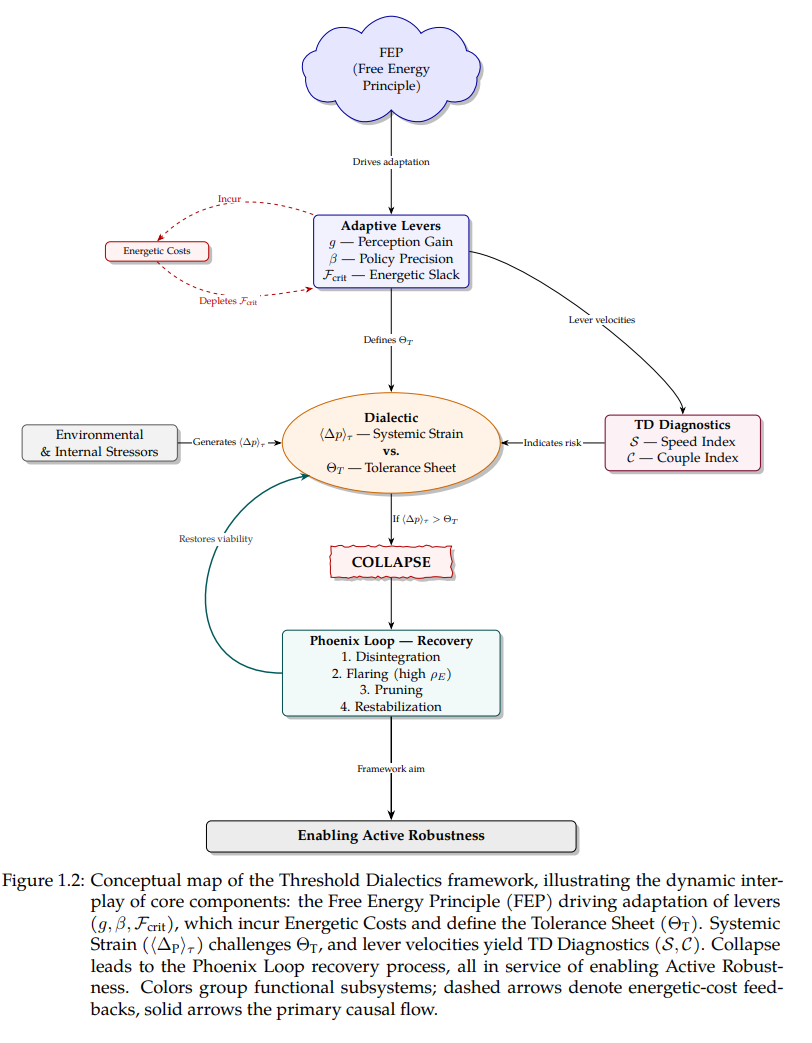
This diagram illustrates the dynamic interplay of core components that govern a complex adaptive system's journey towards or away from collapse.
This section showcases key diagrams and visual representations from the book "Threshold Dialectics" to help illustrate its core concepts.
This diagram illustrates the dynamic interplay of core components that govern a complex adaptive system's journey towards or away from collapse.
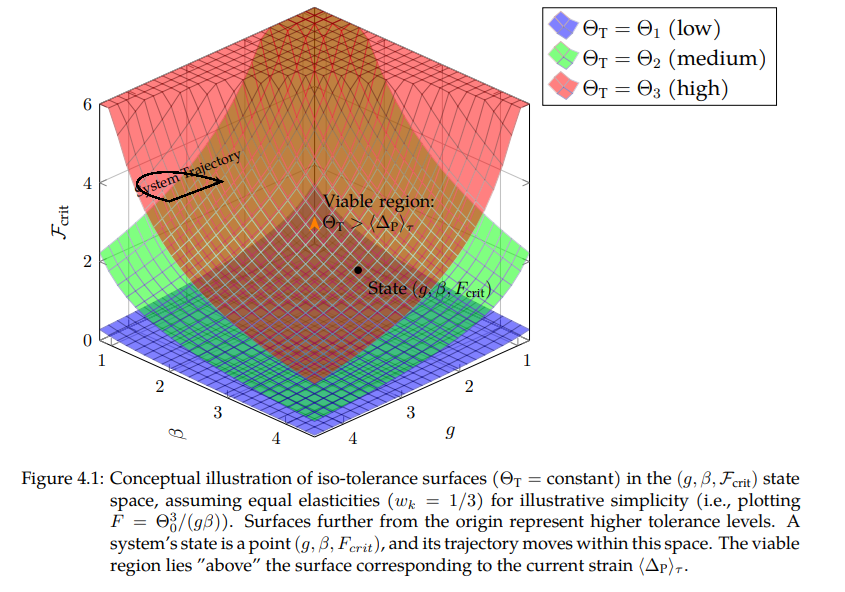
A conceptual illustration of iso-tolerance surfaces (ΘT = constant) in the (gLever, βLever, FEcrit) state space.
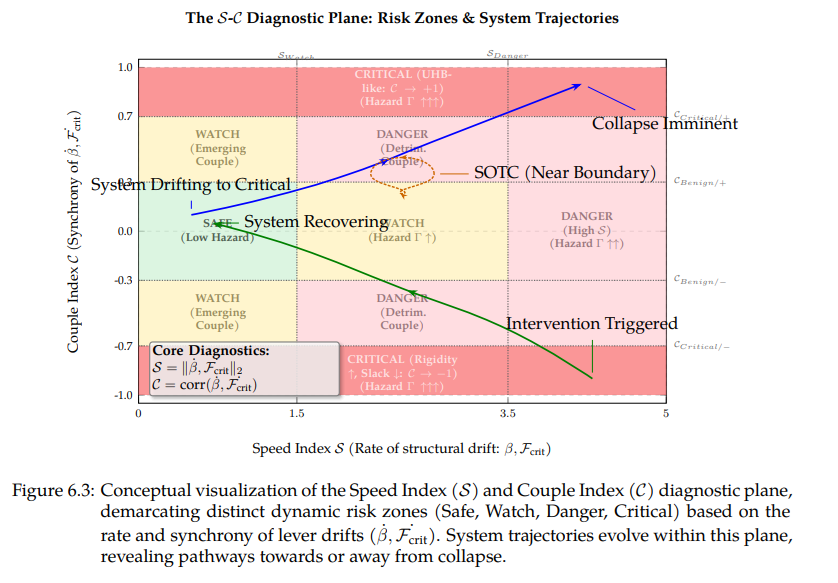
Visualization of the &SpeedIndex;/&CoupleIndex; diagnostic plane, with zones reflecting increasing hazard.
More visualizations will be added. Refer to the book for comprehensive diagrams.